Most trackers only record the past. StockCompass also points the way forward - plain-language insights based on proven math, a goal planner, fair-value estimates and your future dividend income. On your phone and computer. Pay once.
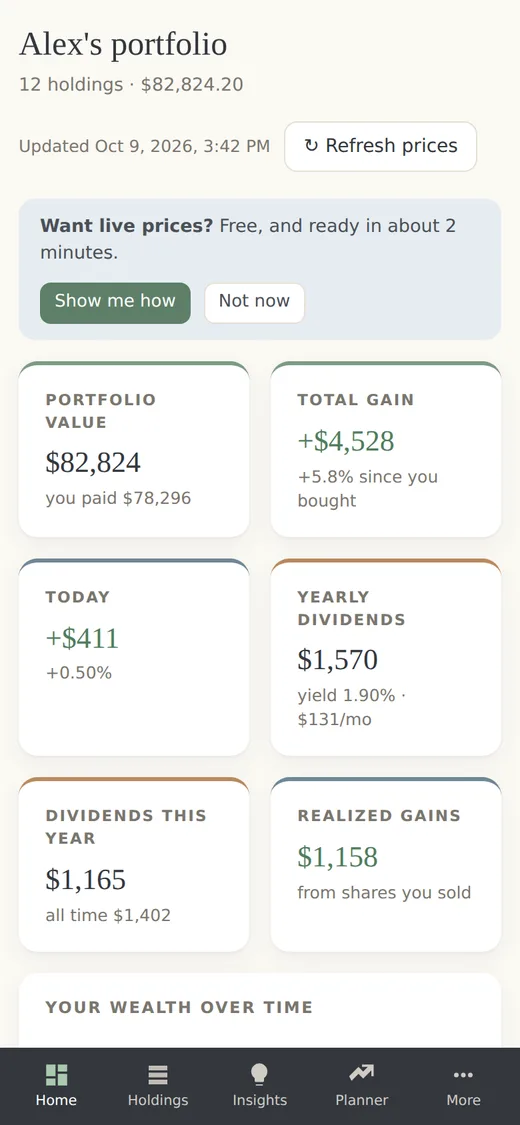
StockCompass does the everyday tracking - and then the part that helps you decide.
| What you get | Most trackers | StockCompass |
|---|---|---|
| Track buys, sells and dividendsAverage cost, gains, yield, realized gains | ✓ | ✓ |
| Smart insights + health scoreClear next steps - each shows its math | – | ✓ |
| DCA goal plannerExactly how much to invest each month | – | ✓ |
| Intrinsic value: cheap or expensive?Graham formula + 5-year DCF with a verdict | – | ✓ |
| Dividend growth with DRIPYour passive income up to 50 years ahead | – | ✓ |
| Rebalance with new moneyWhich sectors to add to - and how much | – | ✓ |
| Pay once - no subscriptionMost tracker apps charge every month | – | ✓ |
| Private - no account, no bank loginYour portfolio stays on your own device | – | ✓ |
Clean sage, charcoal and beige design. No ads, no clutter, no noise.
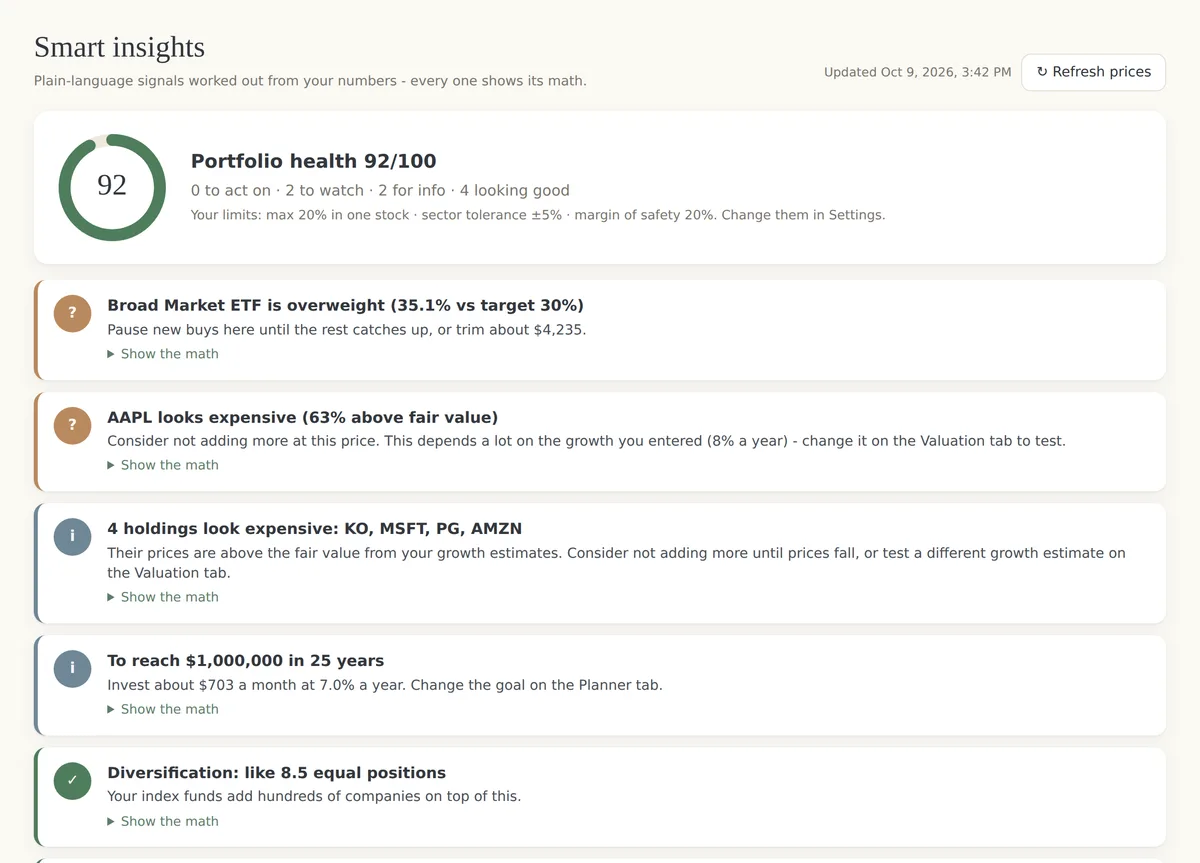
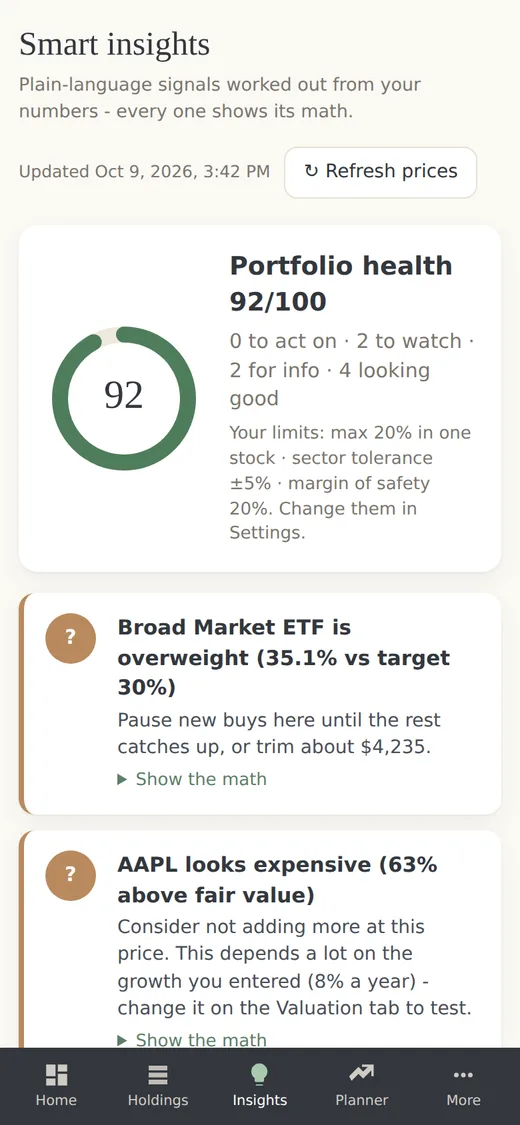
A health score out of 100 and plain-language insights: a stock that has grown too big, a sector under your target, a holding trading below fair value, a dividend that looks stretched.
Every insight shows its math - so you understand the why, not just the what.
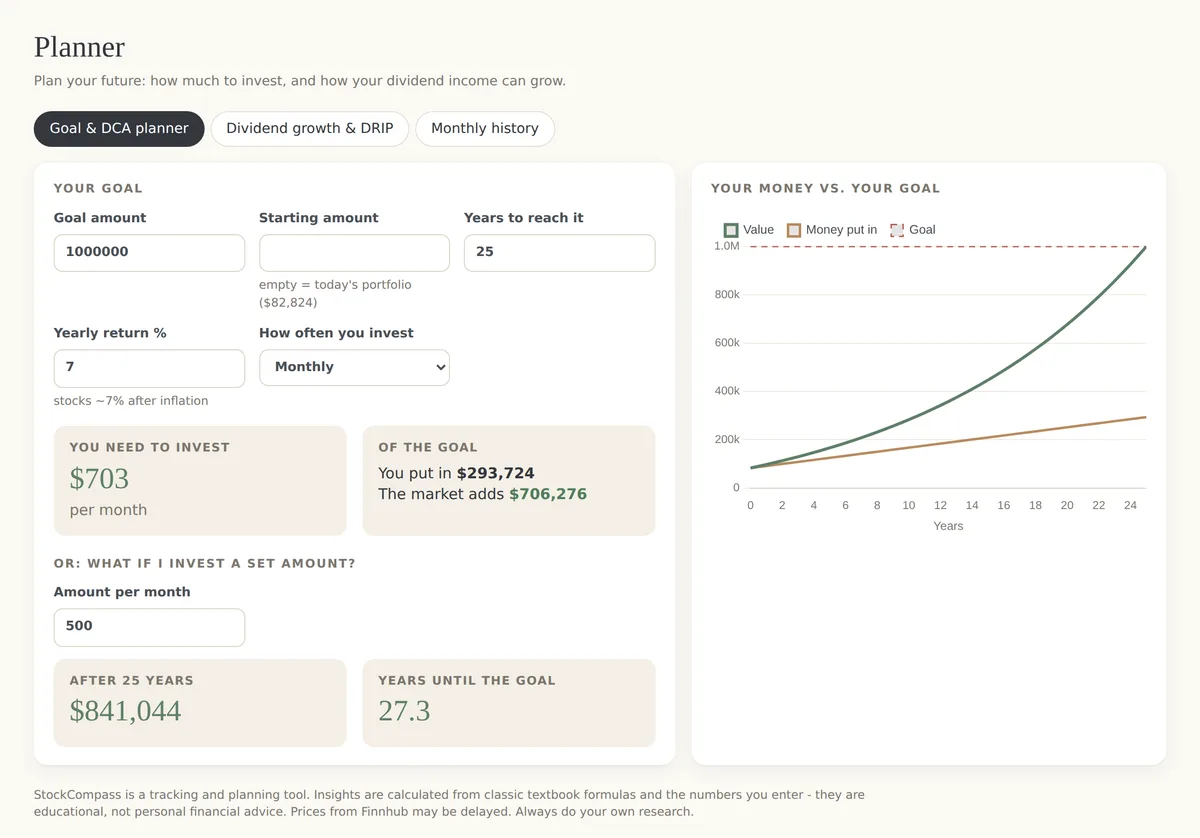
Type a goal - for example 1,000,000 in 25 years - and see exactly how much to invest per week or month. Or turn it around: invest 500 a month and see when you get there.
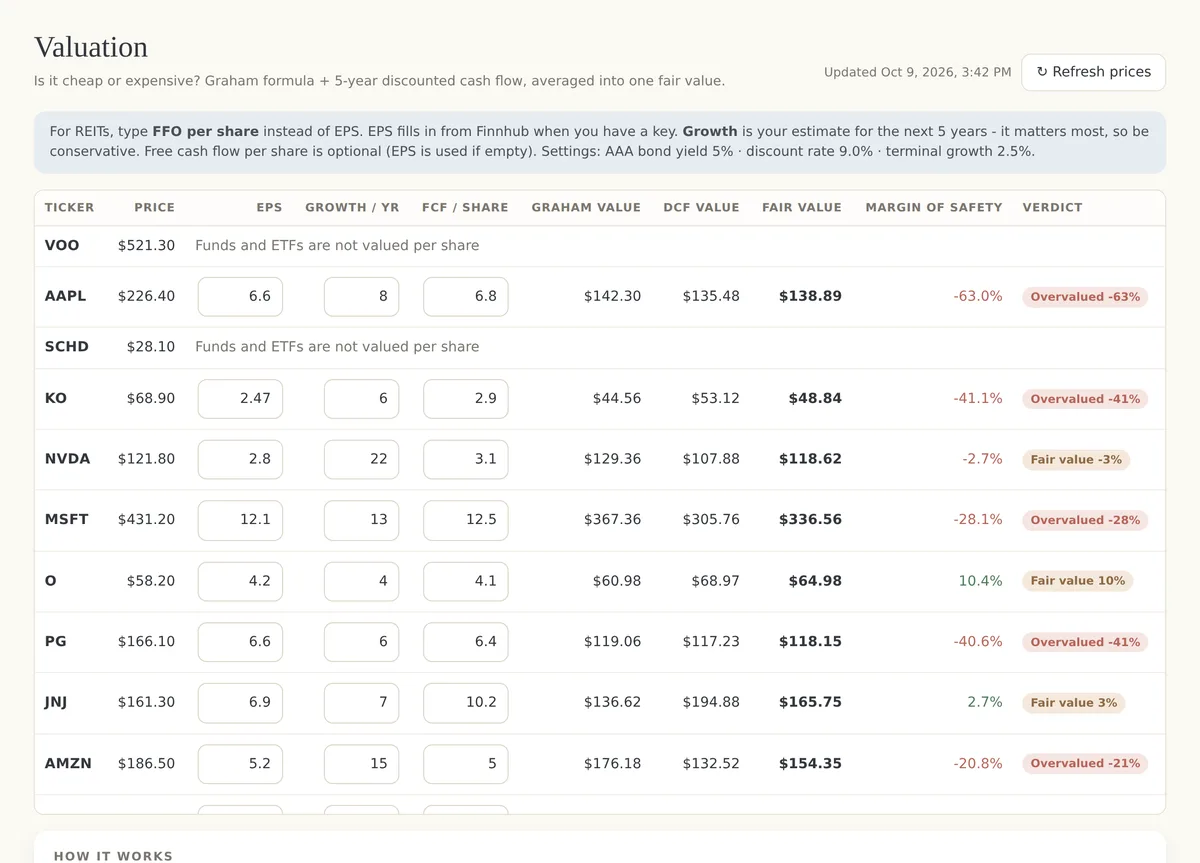
Two classic models - Benjamin Graham's formula and a 5-year discounted cash flow - averaged into one fair value, with a margin of safety and a clear verdict: undervalued, fair or overvalued.
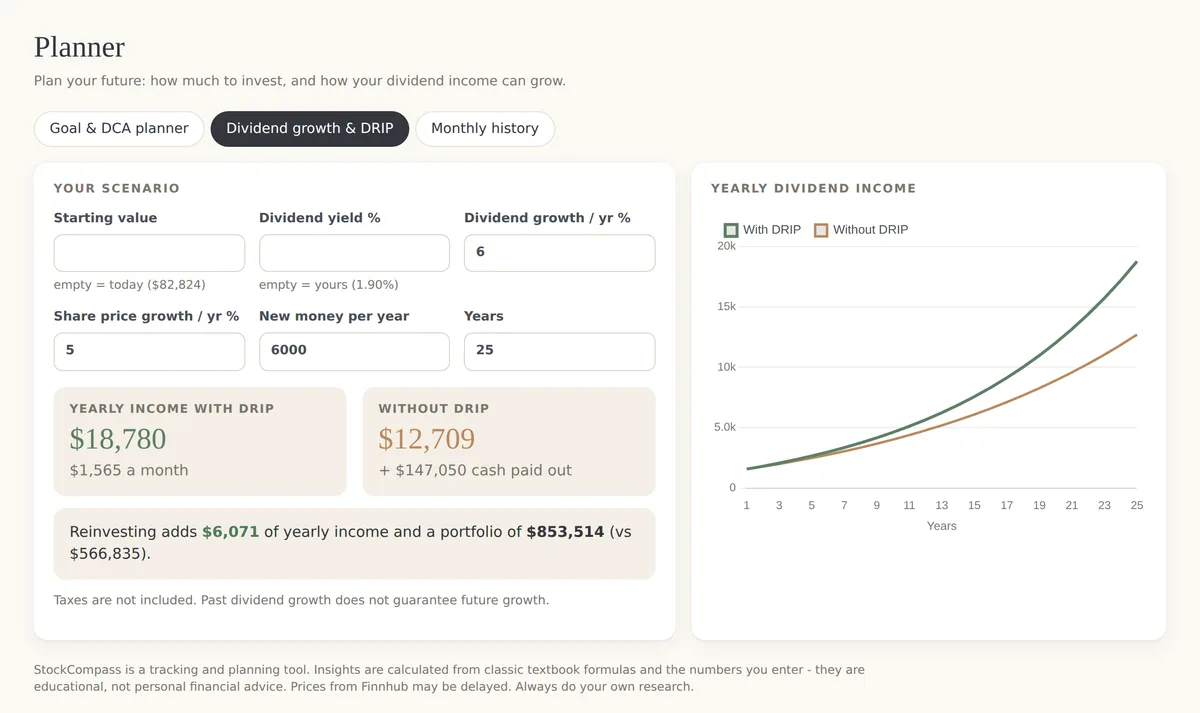
Track every dividend, your yield and yield on cost - then project your yearly income up to 50 years ahead, with and without reinvesting (DRIP).
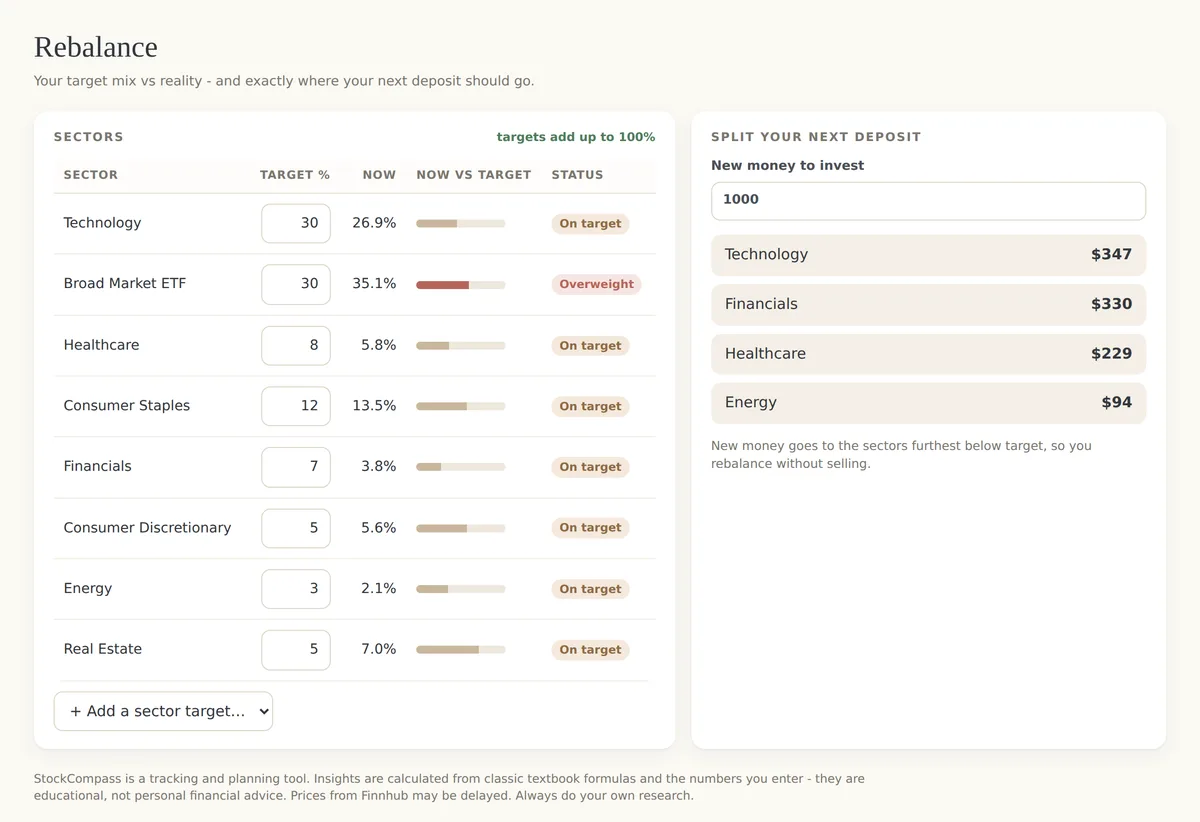
Set your target mix once. StockCompass compares it with reality and splits new money across the sectors that are furthest below target - so you rebalance without selling.
Price and today's move with your own free Finnhub key - the app walks you through it in 2 minutes.
Shares, average cost and realized gains worked out from your buys and sells. CSV import included.
Average down, value any stock, position size and yearly return (CAGR).
USD, EUR, GBP, CAD, AUD, PKR, INR and more.
Download a backup anytime and move your portfolio to another device.
Once activated, it keeps working without internet.
Add it to your home screen like any app - or use it on your computer. One license, two devices.
Nothing to download or install.
Pay once. You receive your personal license key (and a one-click activation link).
Open the link on your phone or computer - the app activates by itself. Add it to your home screen.
A sample portfolio shows every feature. Clear it in one click and add your own buys.
No. You pay once. Live prices use your own free Finnhub key, so there are no running costs for you.
Any modern browser: Chrome, Safari, Edge or Firefox on iPhone, iPad, Android, Windows and Mac. Your license works on 2 devices; you can move it to a new device anytime from Settings.
Only on your own device. Your portfolio is never uploaded - there is no account and no bank login. You can download a backup at any time. See the privacy policy.
Yes, with a free Finnhub key (the app shows you how). US stocks and ETFs work on the free plan; for other markets you can type prices yourself. Prices may be delayed.
No. StockCompass is a tracking and planning tool. Its insights come from classic textbook formulas and the numbers you enter, to help you learn and compare. Always do your own research.
Email pixelsshades2@gmail.com - we usually reply within 1-2 days.
StockCompass is an educational tracking and planning tool and does not provide personal financial, investment or tax advice. Market data may be delayed or inaccurate. Past performance does not guarantee future results.